The post Ecommerce Data Benchmark Report 2023 appeared first on DigitalMarketer.
]]>
2022 was not an easy year, with a lot of declines in key metrics, particularly in the middle of the year. Q4 gave us a reason for optimism though, so will the momentum keep going or will 2023 continue financial uncertainty?
Last year was a watershed moment in the history of ecommerce. While the 2010s saw the rapid expansion of online shopping thanks to developments in mobile devices, the expansion of social media influence, and a massive shift in consumer behavior, this decade will see an even greater change thanks to AI.
Here’s what we found.
How We Aggregate:
Hawke Media uses the data from its proprietary marketing technology platform, HawkeAI. HawkeAI aggregates data across 1000s of businesses’ marketing channels and $100’s of millions in annual media spend to compile these data benchmarks.
Ecommerce Businesses:

Web Analytics
- Revenue was down 5% YoY, which predominantly came from declines in Q2 and Q3 (Q3 was down 16%). We saw stable numbers for Q4 YoY.
- Question for 2023: Does Q4 stabilization represent a broader trend of moving towards growth and predictability, or was it simply a deal-driven BFCM period (which was up 16% compared to BFCM 2021) that is propping up an otherwise stagnant revenue report?
- Average order value (AOV) increased significantly YoY (31%). A portion of this is likely due to inflation, as the AOV increased as 2022 went on, as opposed to 2021 where AOV was consistent throughout the year, even during the Q4 peak retail period.
- Another potential reason for an increase in AOV is a continued emphasis on buy-now-pay-later usage. We saw a 78% increase in buy-now-pay-later usage during BFCM despite rising interest rates.
- Question for 2023: Will the rising cost of debt curtail the use of BPNL option, and ultimately curtail inflation in general? Using bundling and complementary product recommendations (‘you may also like…’) will be key in maintaining/growing AOV without simply increasing prices.
- Sessions overall were down 5%, which aligns with the revenue decline as well, while the bounce rate held steady.
- Question for 2023: As Google Analytics switches to engagement-based metrics it will be interesting to see what metrics and benchmarks will be found in order to assess the quality of a website’s traffic. The simplest answer is of course transactions!
- The quality of those sessions was also down, as transaction rate decreased by 24%. This was offset by the AOV increase (i.e. those that did buy, spent more). These transaction rates were bottoming out at 2% in Q2 and Q3 of this year, compared with all quarters of 2021 being above 3%.
- Question for 2023: With media budgets tightening, optimizing web traffic to conversion is crucial. Where/how brands invest to generate a more optimized site will be key (checkout process, site speed, landing page/promos, etc.).
Organic Channels
- Email marketing saw a gradual decline over the course of 2022 on multiple performance metrics, including both quantity of sessions and quality of sessions. Total sessions from email declined 12% but were flat for most of the year until Q4. Similarly, transaction rates on email declined from 4% to 3% YoY.
- Question for 2023: With these declining results, how can brands attract new email sign-ups and tailor content to not see high unsubscribe rates?
- Organic social content also took a hit this year, with both sessions and transaction rates down. Sessions particularly have been on a steady decline since the start of 2021, decreasing almost every quarter (except for Q4 naturally). This could be indicative of either less content being produced, or audiences that are more particular or selective in what they click on as pandemic restrictions lift and people are not surfing social media the same. Of course, the other possibility is a continued challenge in attribution from various updates to tracking.
- Affiliate was a bright spot for 2022, with a 16% increase in sessions and a 35% increase in transactions.
Paid Channels
- Google Ads
- Spend YoY increased 3%, but distribution was very different
- 2021 saw a linear increase quarter over quarter in spend
- 2022 saw a significant drop off in Q3, and while Q4 increased over Q3, Q4 YoY was down 15%
- Media budgets were definitely impact by economic climate and lifting of restrictions
- Question for 2023: with a year of hopefully no restrictions, and continued economic uncertainty, where will ‘the bottom’ be in terms of spend, when will we see the ramp up?
- Clicks moved in line with spend (up 4%), with predictability/steadiness in CPCs YoY, which is helpful for forecasting in uncertain times. Using a ‘bottom-up’ approach of starting with a CPC type metric to establish sessions expected from Google is likely more reliable than doing a ‘top-down’ approach to forecasting (i.e. where are we going to generate $X of revenue from)
- Eyeballs got more expensive on key visual networks for Google (YouTube and Display), with increases of around 30% in CPMs on those networks. Ultimately both also had lower conversion rates (approx. 15% drop in conversion rates on both).
- These CPMs are still lower than the typical social media platforms, so they still represent a cost-effective option to generate impressions.
- Spend YoY increased 3%, but distribution was very different
- Meta Ads
- Meta Ad spending also increased 4% YoY, but was more linear in growth, with spend increasing each quarter over quarter in 2022.
- Meta Ads also sees a more significant drop off from Q4 to Q1 than Google (Facebook dropped off 14%, Google dropped 4%). This is likely indicative of more seasonality in spending on Meta Ads during peak retail, whereas Google is seen as more of the ‘baseline’ spend to capture highest intent.
- Question for 2023: Will we see this same drop off in spend in Facebook Q1 this year as last year, or will the positive CPMs/CPCs from Q4 on Facebook mean advertisers stay with the platform?
- The increase in spend on Facebook was almost entirely due to a YoY increase in Facebook spend in Q4, while the rest of the year was mostly flat. This is likely the result of the 64% and 47% YoY increases we saw in spending on TikTok and Pinterest respectively.
- Question for 2023: How much of the diversification of social media advertising will continue? The numbers would suggest that any new budgets are being allocated to these new platforms and that Google and Facebook budgets are being treated as optimized/maxed-out.
- Other platforms
- CPMs on TikTok and Pinterest are increasing as more budget shifts to these platforms. For example, CPMs on TikTok increased from $4 to $8 YoY. The CPAs still though are lower than Meta, so until those become more aligned it is likely that these platforms will take more of any increases in ad spend.
- Question: When will these platforms reach the saturation point and competition of Meta and Google? Based on these trends, we would expect to see that by end of 2023.
- CPMs on TikTok and Pinterest are increasing as more budget shifts to these platforms. For example, CPMs on TikTok increased from $4 to $8 YoY. The CPAs still though are lower than Meta, so until those become more aligned it is likely that these platforms will take more of any increases in ad spend.
“Non-discretionary” Ecommerce:
Includes: food/drink, healthcare, B2B

Web Analytics
- The conversion rate from visits to the site increased from 2.6% 2.9% YoY. This is indicative of two key points:
- Once people land on a site with products of this nature (i.e. items that are more essential or inelastic in demand), they have a higher likelihood of purchasing than sites with more discretionary products, which had a conversion rate of 2.2% in 2022).
- There were also fewer sessions for website selling these products, so while conversion rates were up, total transactions declined by 6%.
- Another telling piece of information is the average order value declined YoY, so even though those sessions had higher intent to purchase, the average sale was worth less. This is potentially due to price sensitivity from economic conditions where these products are needed but easily substituted for a lower cost alternative.
Organic & Paid Channels
- To support the idea of shoppers looking for lower cost alternatives, we saw an interesting trend in where sessions came from.
- Typically more ‘loyalty’ based channels such as email, direct, (i.e. someone opens a browser and goes to that page), and organic search were all down YoY.
- Conversely, sessions increased from paid search, social and referral sources. These channels can typically be attributed to more people searching out for new alternatives, as opposed to just automatically buying from known brands.
- Unsurprisingly, conversion rates associated with the more loyalty based channels stayed consistent, with all of them staying within .2% of their previous year number (i.e. someone who clicks on an email from a brand they know were just as likely to buy from that brand in 2021 as 2022, but fewer people were clicking in the first place).
- Also perhaps unsurprisingly, but validates the conclusions above, is that the ‘browsing’ channels of social and referral that drove more traffic, saw declines in conversion rates as more people were searching out new buying options.
- The channel that bucked this trend was paid search, which saw sessions go up 8% and still maintained a conversion rate YoY (3.6%)
- That said, social and referral conversion rates, while down from 2021, were still above paid search (both around 5.5%).
- This could be an indicator that buyers looking for alternatives ‘trust’ or find better recommendations from those social or referral sources than a plain old google search (i.e. perhaps they trust social proof more than google’s search algorithm)
“Discretionary” Ecommerce:
Includes: arts/entertainment, beauty, fitness, home and garden and apparel)

Web Analytics
- discretionary products, which had a conversion rate drop from 2.5% (which was in line with non-discretionary in 2021) down to 2.2% in 2022.
- This makes sense given the economic climate that buyers are going to ‘shop around’ and also makes sense that discretionary items are purchased less frequently than non-discretionary
- BUT, what is striking within the data is that the average order value of purchasing discretionary items went up by 20%, so while conversion rates dropped, those that bought spent more money. As discussed above, there are a few possibilities for this, including buy-now-pay-later usage.
- This is especially interesting since the spike in AOV is heavily skewed to Q4 of this year. AOV was up 41% in Q4 of 2022 compared to Q4 of 2021, which cannot be explained away by inflation. For Q1+Q2 2022, AOV was only up 9% compared to Q1+Q2 2021, which is very closely correlated with inflation rates (around 7% YoY).
- Question for 2023: Was this spike in Q4 pent up demand from people tightening spending the rest of the year, or is this going to continue?
Organic Channels
- The only channel that saw an increase in sessions and transactions was affiliates. Given the discretionary nature of these products, it likely makes sense that affiliate marketing performs well since affiliate marketing predicates itself on social proof, testimonials, and are often more creative in nature from a copy/visual perspective.
- Email had an interesting mix in that sessions were actually up, but revenue and transactions were down. So, unlike non-discretionary goods, consumers were still willing and active in engaging with emails, but were not able to be converted. The most telling stat to this point is that in Q4 2021 email had a conversion rate of 4.4%, and in Q4 2022 that fell all the way to 2.7%, meaning that shoppers were looking for the deals, and were more selective on what deals they actioned.
- This is substantiated by an AOV increase in Q4 2022 compared to Q4 2021 of 25%, so when they did find a deal they liked, they took action in a big way!
- Question for 2023: How often can full retail price be realized? Are shoppers only willing to pull the trigger on deals? How can you structure your sales/products to maximize average order value?
Paid Channels
- We saw declines in ad spending on both Facebook and Google, but Facebook’s was more significant (27% decline) vs Google (4% decline).
- Facebook did see improvements in CPM, CPC and CPA as a result of this decline in spend (less competition). As mentioned above, this spend was reallocated to other social platforms.
- What is interesting is conversions reported actually went up 7%, showing that Facebook had likely reached a point of diminishing returns and inefficient. By peeling back the spend a bit, the more efficient/likely buyers still engaged and bought.
- Question for 2023: are there more efficiencies to be gained by shifting spend, ro are the other platforms soon going to reach a tipping point of saturation themselves? Let this be a case study/lesson in the inefficiency of not diversifying your spend enough!
Lead-Generation Businesses

Quick note: the definition of a ‘goal completion’ or ‘conversion’ when it comes to lead-gen is greatly varying and subjective to each individual business.
Web Analytics
- Goal completions YoY for the first three quarters of the year were up a modest 6% until Q4 which was significantly higher (28%). This is impressive given sessions and bounce rates were relatively flat YoY. In other words, those that went, had intent as indicated by an increase in goal completion rate.
- Question for 2023: With the switch to Google Analytics 4, these benchmarks will become challenging to monitor and the definition of ‘goal completion’ will become morphed into event-based actions. No one really knows what will happen but having GA4 set-up and running on sites today is imperative to get some sense of baseline performance under the new system.
Organic Channel
- Visitors had more intent across multiple channels, which is the opposite of ecommerce trends. For lead-gen businesses, both email and social content generated more goal completions than 2021 (21% and 25% respectively). This is despite social having a 24% decline in sessions.
- Question: Is the decline in sessions due to tracking limitations? Or is it simply consumer sentiment?
- Ultimately, seeing the goal completions increasing is the key benchmark to look at.
Paid Channel
- Google Ads
- YoY was up 3% as well, but Q4 was the lowest spend since Q1 of 2021. This is despite very good results overall from the spending, with conversions from Google Ads improving YoY in every quarter of 2022.
- Question for 2023: What will be needed to ever get brands to invest heavier in Google Ads Network, or is there any appetite at all? Is it saturated? Results would suggest investing in it…Another trick though is performance max campaigns. While they are reporting increases in conversions on performance max campaigns, are those leads becoming sales at the point of sale or in your CRM? Marketers have seen mixed results from these campaigns to date.
- This concern is backed up by a reported 25% increase in conversion rate on cross-network campaigns, which has (artificially?) driven down CPAs by 36% YoY..
- Meta Ads
- Meta spend decreased 13% YoY, but this was dramatically split between the year. In the first half of 2022, the spend was very consistent with the spend in the first half of 2021. However, in the second half the spend declined 28% YoY. Those that stayed invested on the platform though did see declining CPMs (14% decrease) and CPCs (5%).
- Pinterest saw an increase in spend of 10%, and TikTok increased as well, which likely drove the decrease from Meta. Pinterest still does have a lower CPM than Meta ($6 compared to $7), but that gap has closed from $5 and $8 respectively last year. The gap in cost per click has also closed between TikTok/Pinterest and meta.
Lead-Generation Businesses – B2B specific
Quick note: the definition of a ‘goal completion’ or ‘conversion’ when it comes to lead-gen is greatly varying and subjective to each individual business.
Web Analytics & Organic Channels
- Despite the increase in paid media that we discuss below, sessions YoY were within 2% of last year’s total. This indicates that the spend did not have a significant impact on overall traffic.
- Goal completion rates as well were also down about 10%, which indicates that the increased spend and re-allocation of budget did not necessarily lead to higher quality traffic hitting the site.
- A B2B favorite for marketing is email of course. We did see a 13% increase in sessions that came from email, but a goal completion rate that declined by 25%. If the goal of email marketing is to generate brand awareness and engagement with the content that you are sharing (e.g. monthly newsletters, product updates, etc) then mission accomplished for B2B marketers this year, from a loyalty and engagement standpoint email worked!
- If you were trying to use email marketing to get prospects to fill out a lead gen form or activate a trial, then overall that is not what email performance was delivering.
- orOrganic search was a similar story in some regards, we saw an improving bounce rate on organic search sessions, so people were finding the content they wanted more often and engaging with it, but goal completion rate for organic search was down. Again, that ‘goal completion’ may not be the objective and with long sales cycles, etc it is tough to conclude on this but from a direct attribution perspective of someone read a blog and then signed up to be pitched services was not happening as frequently as I’m sure some marketers would like.
Paid Channel
- Let’s actually talk about LinkedIn here, since this is effectively the only category of businesses that care about it

- LinkedIn from an engagement with ads perspective did well in 2022. While media spend did increase by 25%, we saw a larger increase in clicks (i.e. CPC actually went down) and an improvement in click-through rate as well.
- To compare this to the movement in ‘conversions’ is tricky knowing that B2B sales cycles can be longer and the definition of a conversion stops at the website experience and rarely be truly connected back to the real source of truth for B2B companies, the almighty CRM!
- For what it’s worth, we did actually see conversions stay flat despite this increase in clicks.
- Across Google and Facebook we did also see increases in media spend. The google increase was spread across all google ad networks and not concentrated to any one tactic, indicating this was the bi-product of broadly applied budget changes and not a tactic or result specific re-allocation.
- Question for 2023: Will increased spending in digital continue in our new virtual norm, or as restrictions are lifted will spend get redirected back to the traditional B2B staples of trade shows and in-person sponsorships/networking?
- While spending did increase overall in 2022, it was not linear by any means. The increase was predominantly generated by increases in Q1 and Q2 2022 compared to 2021. For example, Google spending for H1 increased by 40% (remember Jan-June 2021 was still very much pandemic-restricted and plenty of uncertainty around supply chains, etc still existed). Conversely, H2 spending was flat YoY.
Overall, from 2022 there are a few takeaways:
- Customer Lifetime Value is more important than ever – with the cost of paid media increasing, it’s more important than ever to keep the customers you get. This means improving product/service quality, enhancing customer experience, and maintaining contact with customers between purchases by providing value-adding information through content.
- You MUST HAVE a cohesive and comprehensive marketing strategy – With AI tools increasing the productivity of marketing managers and allowing all marketers to produce content faster than ever while also managing paid media channels more effectively, the marketer that can produce the best overall strategy will win.
- You need to dial in ALL CHANNELS – As you can see with the data, the effectiveness of paid media, email marketing, and social media is shifting widely between platforms. This means that predicting which channel to focus on will be more difficult. The best marketers will need to both understand and execute cohesive campaigns that span multiple channels to ensure that their message gets through.
- Position your products as a “must-have” – Wallets are a little tighter, and decisions are being made on what is a “must-have” purchase, and what is a “nice-to-have”. In difficult economic times like we’re experiencing currently, customers are looking for what they can cut. The better you can position your products and services as necessary to the customer, the better off your bottom line will be. When in doubt, show how your products can do one or more of the big three for your customers: Save them time, Save (or make) them money, Improve their quality of life
- Get strategic about customer acquisition – With ROAS becoming less predictable and having potentially longer timelines before proving profitable, it’s a good idea to offset your customer acquisition costs by forming strategic partnerships, affiliates, and influencers who can provide new customers regularly at breakeven or better to remain cash flow positive.
The post Ecommerce Data Benchmark Report 2023 appeared first on DigitalMarketer.
]]>The post How to get free leads and sales with social [VIDEO] appeared first on DigitalMarketer.
]]>If you are having a hard time getting leads and conversions from your social media marketing right now, then you want to watch this video where Kris Krohn goes over:
- Which social media channels YOU should use based on your business
- How to know what kind of content to create to generate organic views
- How much content you should put out each week (without killing yourself) and,
- His top tip for taking off on social media
Kris went from relative obscurity to celebrity-level status (and an 8-figure business) really quickly all on social media marketing…and without spending a dime on ads.

The post How to get free leads and sales with social [VIDEO] appeared first on DigitalMarketer.
]]>The post Digital Marketing Data and How to Optimize Like a Champ appeared first on DigitalMarketer.
]]>
There’s so much data, from so many different sources, with so many different reporting tools, that you could just drown in reports, attribution, and meetings. With so much noise out there, it’s important that you look at the data in a certain way. There’s important information hidden in the metrics that will help direct your digital marketing strategy.
In this article I’m going to walk you through this technique that I’ve been using for 25 years, called MAA.
Metrics, Analysis, Action
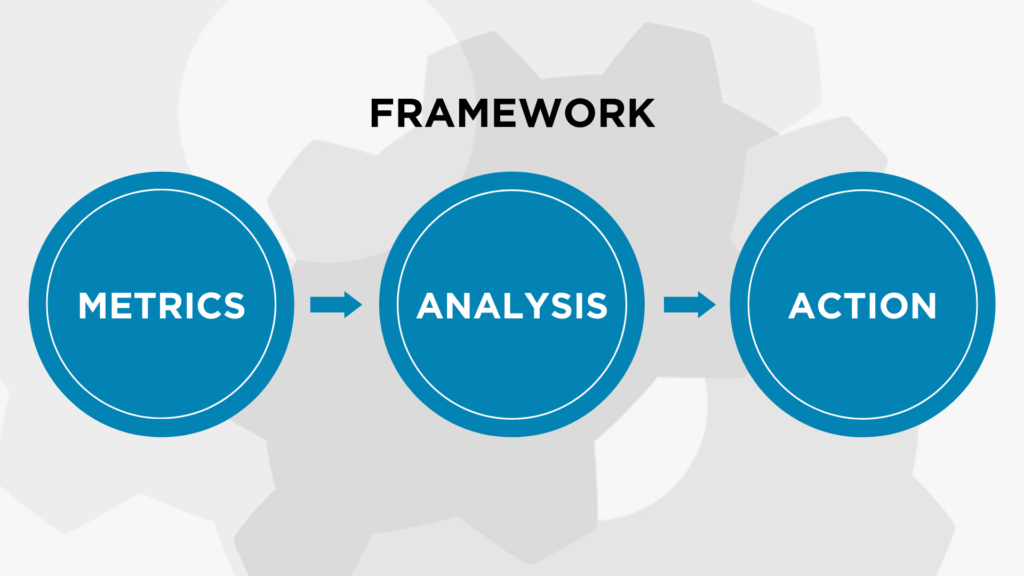
MAA stands for metrics, analysis, action.
Let me show you how powerful it is when you use this technique on any kind of data set you have. It could be SEO data, website data, email data, conversion data, shopping cart data.
The Data Doc is in…
Think of this as if you are a surgeon in the emergency room. You must follow these three steps.
- Collect vitals.
- Diagnose.
- Treat.
First you collect the vitals. It could be heart rate, blood pressure, respiratory rate, x-rays things like that. These are the numbers that clue you in to the cause of the problem.
The second phase is the diagnosis. In this phase you interpret all the vitals that you collected. Based on the data, you make the determination of a heart attack, broken bone, virus, etc. The key point is that the diagnosis is based on the data.
From that diagnosis, you create the treatment plan. The plan might include surgery, medications, a recovery plan, etc. But the list of things to be done to make the patient healthier is based upon the findings and the diagnosis.
The marketing analytics data you collect leads directly to analysis of the problem. That then leads directly to the action. What I will show you in this article is a number of examples from a variety of digital marketing projects. This works whether you’re working on a large or small project.
Data vs Analytics
Lots of people think that they have analytics because they have Google Analytics installed on their website.
But let me tell you a dirty secret.
There are no analytics in Google Analytics. It’s just Google charts. It should be called Google Chart-Maker.
Marketing analytics is figuring out what’s actually going on. It’s the interpretation of the data. Interpreting the data tells you why sales went up or down. It helps you discover why conversion rates went up or down. Analyzing the data answers questions like:
- Why did people buy or not buy?
- Why did a competitor take a certain action?
- Where are we losing customers along the customer journey?
- Is our content hitting or missing with our customers?
Analytics is more than making charts and collecting data. And action is the next step after marketing analytics.
The way we see it, if you are not taking action based on the analytics, which was based on the data, then whatever you’re doing is random.
Returning to our analogy, not everyone should take the same pill. If you’ve got a broken bone, you shouldn’t take the same medication as someone who has a headache. So the action that you take, the optimization, should be contingent upon the analysis, which should go straight back to the data that you gathered.
Most people make the mistake of just trying to look at lots of data. This Metrics Analysis Action framework is the easiest way to figure out what you really need to do versus what’s noisy.
MAA Framework Case Study: Ecommerce
If you are in ecommerce, lead gen, or any kind of performance marketing, then you’re going to start with the action, mapped back to the analysis, and back to the metrics.
Because the actions are all the things that you could do.
So make a list of the things that you could do.
- You can play with the website.
- You can change your budgets.
- You can change ads.
- You can optimize creatives.
- You can work with influencers.
- You can buy another tool.
- You can change bids.
Think of all the actions that you could take. Start with the end in mind.
Once you decide on the action, look for the trigger. In other words, when analyzing the data, what diagnosis will cause you to take that prescribed action?
That’s where you have automated rules on Google, Facebook, or Shopify. Wherever you’re looking at data, you can set up these rules.
For example, if your cost per acquisition goes above $50, then turn the ad set off. If someone leaves a positive review on Yelp, then reach out to them to say thank you.
So if a certain thing happens, then here’s the particular action.
Then there’s a limited number of things that you could do, so you don’t have to look at everything. And then if you need to determine if that triggering condition is true, then what data do you need?
Data, Analytics, and Attribution

On the far left of this image, we have plumbing. Plumbing is collecting the data from different tags in tag manager, UTM parameters, pixels that are firing, and other events inside an app.
These are the things that people are doing. For example, opening an email. When that happens, you get plenty of email marketing data. But the data doesn’t mean anything unless you can tie it to a goal.
How do you tie data to a goal?
Here’s a lifetime value example…
Seeds of Life sells flowers to people who’ve experienced the death of a loved one. The lifetime value (LTV) of a customer is $150. What can they do to increase the LTV?
They might offer a referral bonus, free shipping for orders over a hundred dollars, etc. Their goals, checked against the marketing analytics, will determine the direction of their next marketing campaign.
The important thing is to define the goals and measure them against the data. If the data doesn’t tie to the achievement of a particular goal, then you have to ask, “why are we even collecting that data?”
We’re not searching for a needle in a haystack, here. Although, that’s what most people do with their reporting.
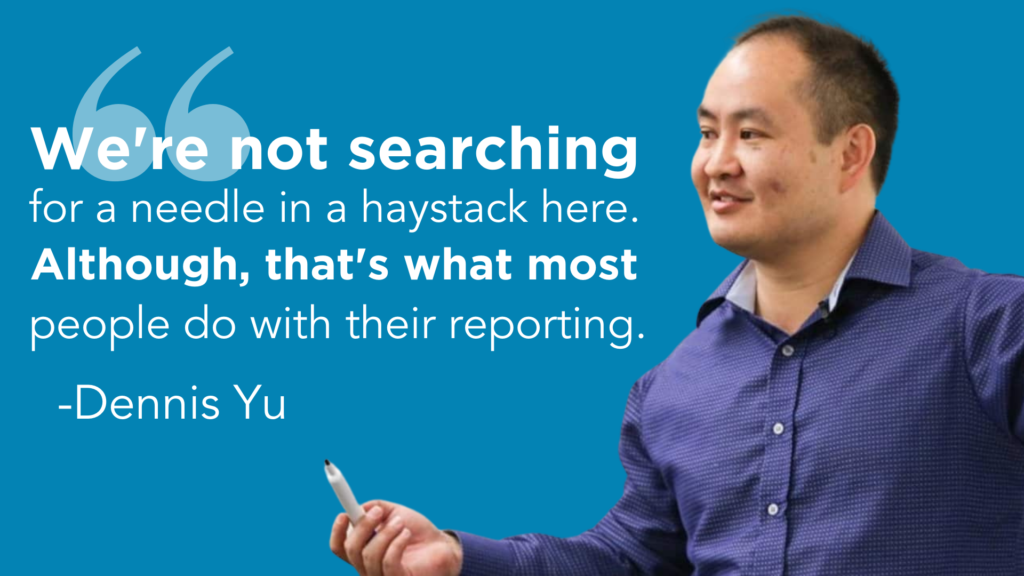
Most people log into Google analytics, or whatever they use to pull in all the data from all the different places. And then they just hunt and peck and wander around and look for interesting things.
They look at the data then filter down to this date for that particular segment and this part of the country. It’s like the lotto, like the power ball where you choose six random balls to try to win the million dollar jackpot.
You want to have your goals before you figure out the plumbing.
Don’t Make the Same Mistakes with Analytics
Large and small companies make the same mistakes. They tend to go after impressions or click through rate or secondary metrics when the primary metric, the business goal, is more important than a diagnostic, secondary metric.
I love looking at cost per mille, or CPM, in advertising. For example, how much are you paying per thousand impressions? What is the trigger or check engine light, to let you know whether the algorithm is penalizing you for having a low click through rate, low quality score, low relevance score, etc.
Analyzing a marketing campaign in this way may show that something else is wrong.
Please don’t make the same mistake thinking that a secondary metric like click through rate, cost per click, quality score, or CPM is more important than the main business metric.
Profit, lifetime value, or cost of acquisition should be the goals that tie to your content and targeting.
Plumbing, Goals, Content, Targeting, Amplification, Optimization…
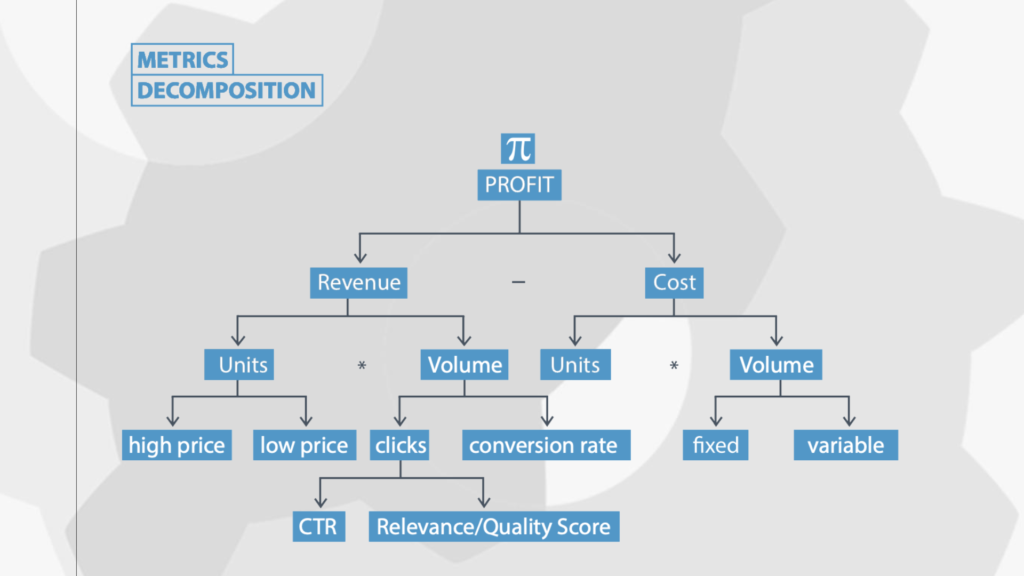
Here’s an example (above) of a marketing campaign we ran for our friend, Brennan.
At the very top are the financial metrics, specifically profit. There’s some kind of margin with or without cost of goods and services or overhead.
Then we have revenue minus costs.
Revenue is driven by factors like conversion rate, LTV, and how well you use things like recency and frequency to increase revenue.
Then there’s costs: people costs, ad costs, software costs, other kinds of costs.
On the revenue side, units (high price vs low price) multiplied by volume (clicks and/or conversion rate) is your revenue.
On the cost side, let’s say you run all your digital marketing campaigns on a cost per click basis. You can break that down to different fixed and variable costs. So we know if we double the number of clicks we’re buying from Google, we’re going to pay twice as much. Multiply the cost by the number of clicks you get for the overall cost of that campaign.
This decomposition pyramid helps you figure out the data you need to collect using secondary diagnostic metrics.
Start to think about how those different metrics will help you uncover the main issue to focus on right now.
MAA Framework: Case Study
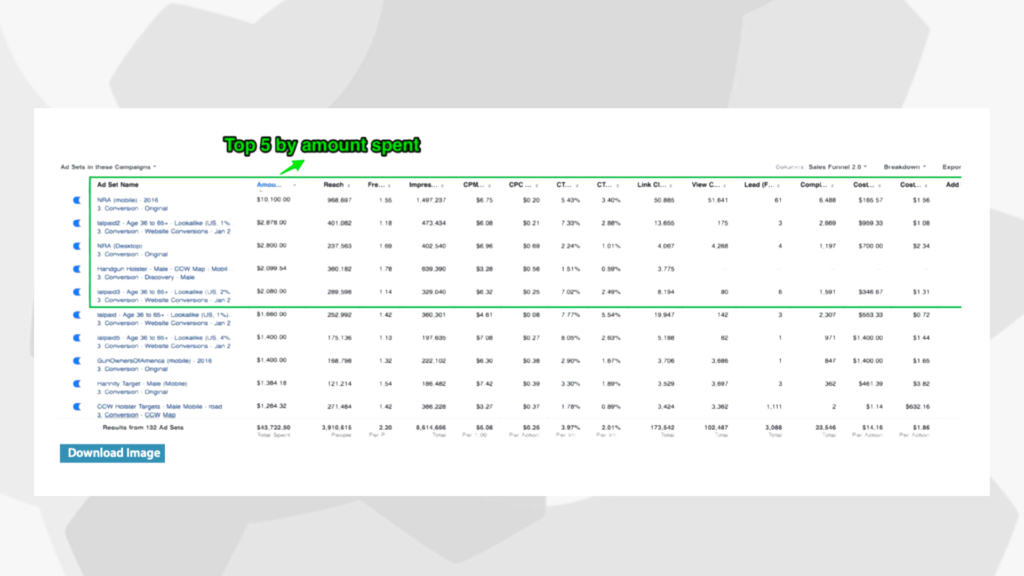
Let’s look at how this actually applies when you’re looking at tabular data.
In this example (above), we’re looking at a lot of information. There are 132 ad sets here. That means we have all this information for 132 projects…
- Data
- Campaigns
- Ads
- Landing pages
- Messages
This happens to be a set of Facebook campaigns, but it could easily be any social media platform or other traffic source.
We use a concept called “Top N” to select a manageable number of ad sets to work with. Why? Because it’s intimidating to try and look at ALL of them to diagnose the problem or issue.
You don’t have time to look at every single keyword, creative, or landing page. The idea of Top N is to look at the top, best- or worst-performing ad sets and ignore the rest. This is just another way of using the 80/20 rule or prioritizing your work.
I find that when you use the Top N technique on any large dataset you can quickly zero in on the most important thing.
In this case, we can see that this very first ad spent $10,000 out of $43,000. That means 25% of all of the money being spent is inside that one ad out of the 132 ads total.
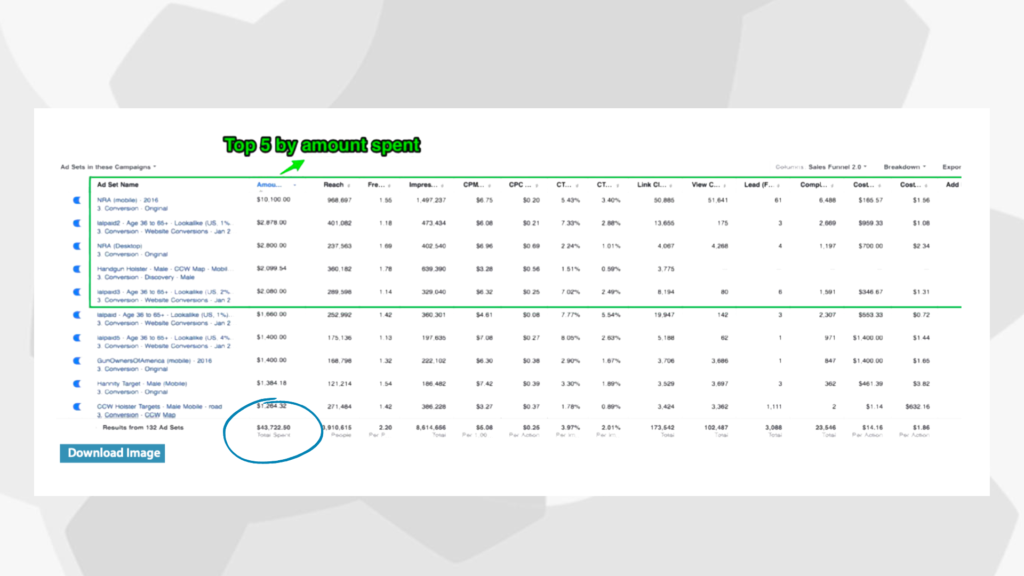
Look a little more closely and you’ll see the top five already account for 60% of the total spend.
That’s not uncommon. In lots of cases the top three to five ads will account for about half of your ad spend.
Applying the Top N Method
I like to start by doing Top N on spend, because that’s where I can identify a “bleeder” (a high-spend ad with very low return).
Then I look at what drove the most revenue or had the highest number of conversions. Because then I can find where the winners are.
Then I look at clicks, leads, or other metrics that are important to the business.
Using this method, I kill the losing ads and amplify the winning ads.
Let’s say you were to sort just by conversions or revenue. If you do that, then you could have an ad that’s wasting lots of money that doesn’t make it into the top four or five for your most important metrics.
So I use Top N for three or four metrics in succession. Each time it reorders the ad sets or ads or creatives or whatever it is that you’re looking at.
You can use this method to determine ad performance in just three minutes.
Find and Fix the Issue
If something’s out of whack, it could require a big change or it could be something wrong with the tracking.
It could be iOS 14, or the pixel wasn’t on that landing page. It could be the data didn’t come through and it’s delayed. There’s all kinds of things that could play into why numbers aren’t adding up.
A lot of people freak out when sales are way down. Understandable. But many times it’s because of some silly issue. So before you pull the fire alarm, just think, does that really make sense?
I like this particular ad here.
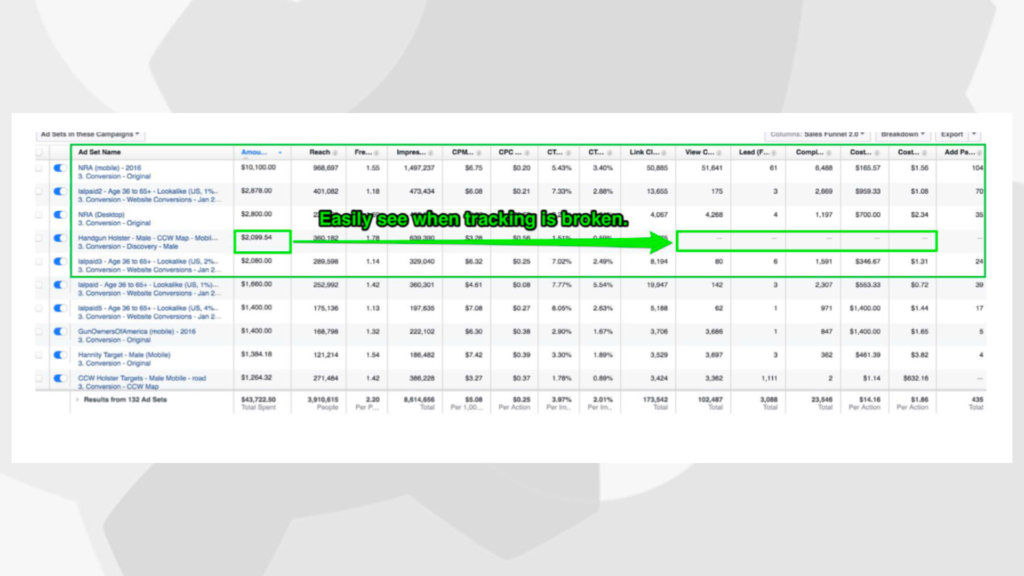
There’s no way we spent this amount of money with no return. So we know there’s an issue. And we know with social media platforms like TikTok, Twitter, and Facebook, their systems often will not show data.
We know that because of the iOS 14 update, impressions and clicks are reported on different frequencies. So you might see a bunch of spend show up before the conversions show up or vice versa.
Make sure it’s statistically significant. Also make sure that you have enough data, so you don’t jump to any conclusions.
We’ve seen these systems spiral out of control. For example, let’s say you decide to reduce the bid amount on a marketing channel when the ROI falls below a certain amount. That seems logical. But if you’re only looking at revenue, not conversions, you might kill off a marketing campaign that was actually working quite well.
Imagine if it all boiled down to a hiccup in the data that caused the downward spiral. Not good. So be careful about that.
Now, if you see that a metric is out of whack and the data looks good, then ask yourself why that campaign isn’t performing as well.
Data and Instinct for the Win
Don’t let everything you do be completely automated and dependent upon rules. A successful marketing strategy requires a human touch.
Don’t set so many rules that the software automatically terminates your ads.
Instead, take a moment to look at how far out of bounds the ad performance is. It could be that you launched a new campaign and you’re doing an AB test or some kind of split test. The winner stays on and continues to win, even when other ads are losing, because you’re trying to find another winner to take its place.
If the cost per acquisition is high, then you can break that down using the metrics decomposition pyramid.
For example, the cost per acquisition will double if:
- the conversion rate is cut in half and the cost per click is the same
- the cost per click doubles and the conversion rate is the same
The cost per acquisition remains the same if either factor doubles while the other one is cut in half.
Always look at your marketing analytics when the cost per conversion goes up. Determine whether it’s because of the cost per click or the conversion rate.
When you run ads using objective-based bidding you don’t have to worry as much about cost per click, click through rate, or conversion rate because the artificial intelligence behind the ad platform is going to seek your target metric.
If the target metric is out of whack, you can decompose it into the underlying metrics.
That’s true for organic traffic. But it’s not as true for paid traffic because the systems are getting smarter and can optimize for the objective you set. Either way you should still look.
Balancing Metrics
This method gets you to look at metrics that matter according to our business goals. It gets you to think about and analyze why the data might be good or bad. And it gets you to outline the actions you’re going to take when goals aren’t being met. Over time you’ll find that the same pairing of metrics change alongside each other. So let’s talk about what these balancing metrics are.
One company we were working with was spending a hundred thousand dollars a month on advertising. When they were unhappy with the return, the analyst on the project adjusted the Google ad campaign. All of a sudden the cost per conversion dropped from $20 per lead to $7 per lead.
But I wanted to know how and why it dropped so dramatically. I found out that this person went into the Google ads campaign and turned off all the campaigns except for the brand search terms. Of course it was going to convert super well!
But the balancing metric was volume. When the analyst “fixed” the cost per conversion, the number of leads dropped from 5,000 leads a month to maybe a thousand leads a month.
The key takeaway here is that if you optimize one metric blindly, you can fool yourself into thinking everything is better when in reality another metric took a nosedive.
Analyzing Like a Scientist, but NOT a Rocket Scientist
Metrics don’t matter, unless there’s a clear analysis that can come from the information. Remember, you’re seeking a diagnosis.
Think like a surgeon or scientist. Start with a hypothesis. If a certain thing happens, what will you do to correct it and what outcome do you expect? If there’s no potential action based on some metric, there’s no need to gather the metrics.
I see companies spend most of their efforts collecting data. No one even knows why they’re using the data. Be strategic and ask, “what are we doing with this data? Is there some meaningful action we’re going to take?”
Maybe there’s another metric that would measure the goal better.
The point of analytics is to figure out whether something is worthwhile. Most of the data you thought was important, doesn’t even matter.
I’ll give you one example. Our client was a large company, but this works for small companies, too.
We were working with an airline, taking one database and matching it against another. They wanted to know things like whether a customer that goes skiing has kids and what their income was.
They wanted predictive models to uncover which customers would be most likely to sign up for their credit card or buy flowers or upgrade or travel to new destinations.
We went all in on the idea that more data is better. After all the time and money spent on sophisticated data models, what we found was that the best predictor of people flying more was past purchase behavior. Not a surprise, right?
In this case, purchase behavior predicted purchase behavior. And the fact that they drove a station wagon, or liked to eat Haagen-Dazs ice cream, might be interesting but it had very little impact on their flying behavior.
Moral of the story, you might find that the most obvious thing is the best place to start optimizing in your business as well. Start thinking about what kind of “if-then” logic you can implement. And don’t dismiss the really simple idea just because it’s simple.
The MAA Framework is Not Just for Advertising
Collecting data allows you to put if-then sequences in place across your business. In Google and Facebook you can set up automated rules using if-then logic. For example, one might be for conversions. If conversions fall below a certain number, then an automated action would be taken or an alert might be sent to whoever’s in charge of that area to let them know there is something that needs their attention.
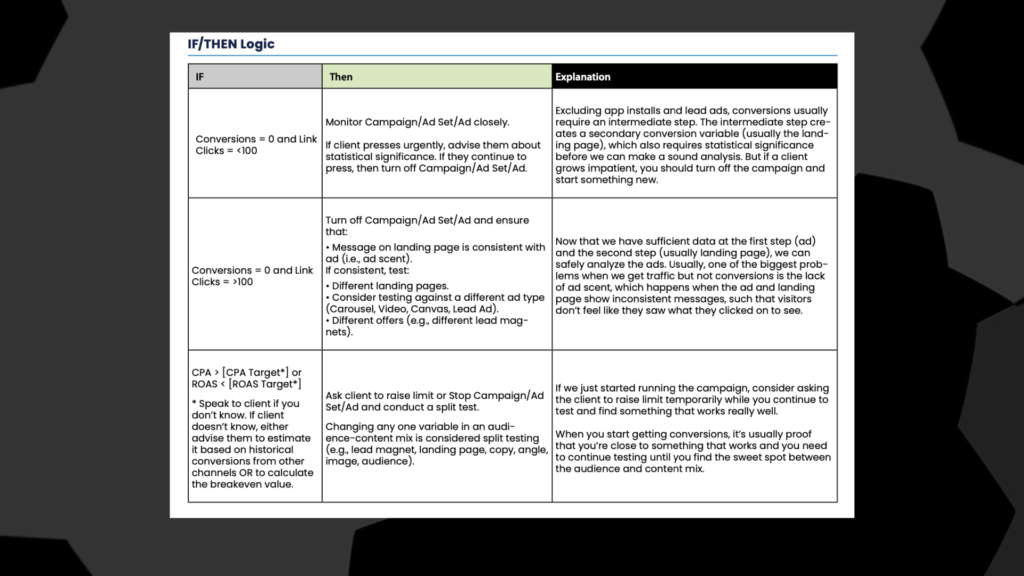
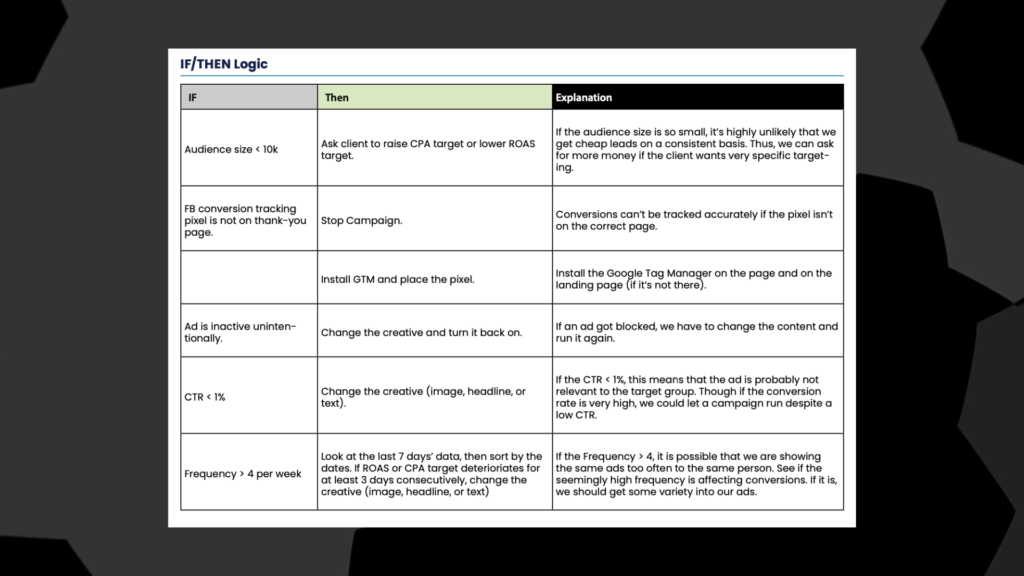
Here is a table of common if-then scenarios we’ve come across. Start small by looking at just a few of these things.
You’ll find a lot of value when you look at the patterns. For example, look at posts with the highest engagement versus posts with the lowest engagement. What can you learn? What do the high-engagement posts have in common? Is there a cross-over with the low-engagement posts?
Don’t spend all your time messing around inside the tools. Even Google’s head of analytics said that 90% of every dollar you spend on analytics should be on people and 10% should be on the tools.
We see a lot of businesses do the opposite. They spend 90% on tools and 10% on people. The hard truth is, the most sophisticated tools are useless without someone who knows how to make sense of the numbers.
To ensure success, set the framework in place. Make it clear that everyone is accountable for the results.
Summary
I hope the metrics, analysis, action framework I’ve just introduced you to encourages you. Data and analytics aren’t really that technical. You don’t have to collect a ton of data, build regression models, or feed your AI any recipes.
Customers buy this over that. It’s not math. It’s not huge databases. It’s not engineering.
The MAA framework is all about understanding the numbers in the context of business performance and goals. Tracking metrics should always begin with the business strategy in mind.
The post Digital Marketing Data and How to Optimize Like a Champ appeared first on DigitalMarketer.
]]>The post Building a Successful Business: 5 Foundational Metrics [VIDEO] appeared first on DigitalMarketer.
]]>Our very own Cydney D’Costa shares knowledge we’ve gathered from years of experience and countless hours serving clients. Prove to your clients their money and business are in good hands and that you’re invested in their success by sharing these foundational metrics with them:
- Traffic
- Engagement
- Subscribers
- Customers
- Customer Lifetime Value
Learn the right data to collect and how to interpret it to help clients see what’s going on and why your services are so valuable.
In this video:
- Engagement Metrics to Keep a Close Eye On: 1:30 – 1:41
- The Most Common Mistake People Make on Social Media 1:53 – 2:05
- How to WOW Agency Clients & Stand Out From the Crowd 2:56 – 3:15
- The Magic Zone for Marketers and Businesses 4:25 – 4:31
Download the Customer Value Journey aka Super-charged Sales Funnel  https://www.digitalmarketer.com/ebooks/1-page-marketing-blueprint-download/
Hire a Certified Partner and Put Your Business in Good Hands https://www.digitalmarketer.com/find-a-certified-partner/
Agency Owners: Learn Our Proven System for Taking Your Agency to the Next Level https://www.digitalmarketer.com/blog/customer-value-optimization/
The post Building a Successful Business: 5 Foundational Metrics [VIDEO] appeared first on DigitalMarketer.
]]>The post How SMART Checks Can Help Your Metrics – Amara Omoregie [VIDEO] appeared first on DigitalMarketer.
]]>How SMART checks can help your metrics.
Amara Omoregie, Founder & CEO of amaraREPS talks about how to review your growth scorecards for maximum results.
WHAT IS DIGITALMARKETER:
DigitalMarketer is the premier online community for digital marketing professionals. It’s a place where you can learn how to market like a pro, connect with industry experts, and get the strategies and tools you need to grow and scale your business to new heights.
The post How SMART Checks Can Help Your Metrics – Amara Omoregie [VIDEO] appeared first on DigitalMarketer.
]]>The post The 5 Metrics Every Marketing Client Wants to See appeared first on DigitalMarketer.
]]>
Your marketing clients are just like you.
As a marketing consultant or agency owner, you want to see:
- More traffic
- More engagement
- More subscribers
- More customers
- Higher customer lifetime value
These metrics are the foundations of a successful business (whether it’s a marketing agency or an ecommerce drop shipping business). If you don’t have traffic, you won’t have customers. And if you don’t focus on your customer lifetime value, you won’t have a sustainable business model.
This is exactly why these are the metrics your marketing clients want to see. They want to know you’re increasing their brand awareness and marketing to their customers after the first sale. Because that’s how you build a long-term relationship with the brands you work with and create a marketing consultancy that makes people ask, “How the heck did you pull that off?!”
And it all starts with focusing on these 5 metrics and sharing them with your clients.
#1: Traffic
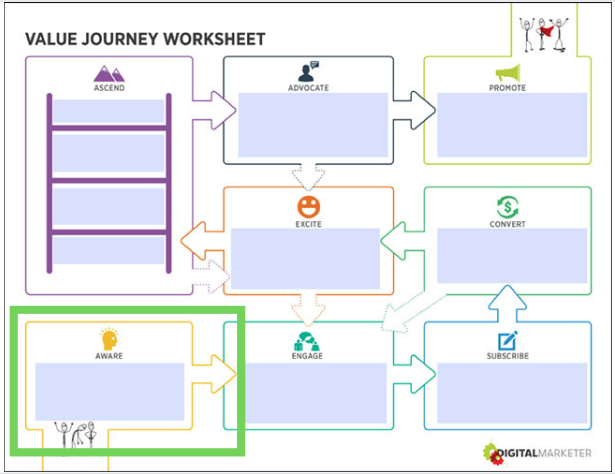
Every marketing client wants to look at their Google Analytics dashboard and see that beautiful up and to the right line that signifies they’re getting more traffic than ever before. Traffic is a huge part of marketing because it leads to the first stage of the Customer Value Journey, Awareness.
People can’t buy your client’s products if they don’t know their products exist! With increased traffic, more people see their brand. The more people that see their brand, the more people can buy their products.
Just like 1+1 = 2, more traffic leads to more customers. Well, as long as you’re making sure to attract the right kind of traffic. Not only can you show your clients their increased traffic to social media (impressions) or their website (through Google Analytics), but you can also show them the demographics behind this traffic. This shows that these aren’t random people who *might* be interested in buying their products. These visitors are their customer avatar, which means they can quickly turn into customers with the right funnel.
Here are a few traffic metrics to share with your clients:
- Impressions on social media
- Demographics on social media
- Traffic on Google Analytics
- Demographics on Google Analytics
#2: Engagement
Engagement is the number of likes, comments, shares, and interactions people have with your content. For example, if someone comments on your Instagram post—that’s engagement. If they read your blog post—that’s engagement. If they reply like your tweet—that’s engagement.
And that’s the start of turning a viewer into a customer. Like the Customer Value Journey outlines, the first step in the customer journey is awareness. It’s the moment someone finds out your brand and products exist. It’s a crucial moment, but what’s even more important is what comes afterward…
…the first time someone actively engages with your brand.
Engage is the second stage of the Customer Value Journey. It’s so important because it’s like this person just raised their hand and said, “You have products that help me solve one of my problems!”
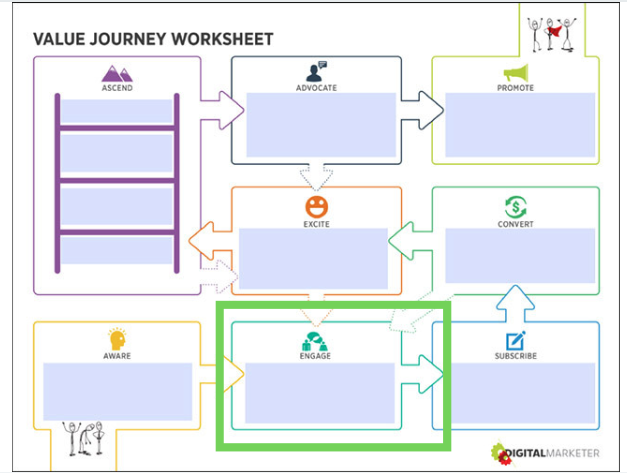
Your marketing clients want to see engagement because that tells them you’re doing your job as a marketer. You’re increasing brand awareness to the right people, who are now engaging with their brand so they can move to the next steps of the Customer Value Journey, Subscription, Conversion, Excitement, Ascension, Promotor, and Ambassador.
Here are a few engagement metrics to share with your clients:
- Increased social media engagement per post and on average
- Decreased bounce rate
- Longer time spent on page
- Heat maps of sales and product pages
#3: Subscribers
With traffic and engagement comes subscribers (if you’ve properly built out your marketing funnel!). Your goal as a marketer is to turn traffic into subscribers, building a deeper relationship between brand and customer avatar. You never want to house your audience on someone else’s platform, like Facebook or Google. You want to take your social media or website visitors and add them to your email list as soon as you can.
This is stage 3 of the Customer Value Journey and usually comes alongside a lead magnet freebie that people opt-in for. For example, you could give away a free webinar or a discount on commerce products.
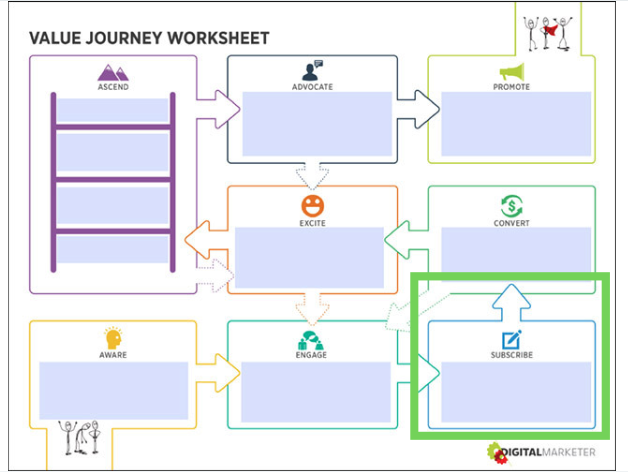
Your clients want to see that traffic and engagement have a predictable ROI. That predictable ROI comes from knowing, for example, 1% of their subscribers convert. Based on the average number of people subscribing per day, you can predict how many customers and how much revenue they’ll make.
Just like you want your marketing consultancy or agency to have a predictable income, your clients want the same thing, too.
Here are a few subscriber metrics to share with your clients:
- The average number of subscribers per day/week/month
- The average percentage of subscribers becoming customers
- Open rate
- Click-through rate
#4: Customers
This is the metric you probably didn’t need us to tell you about. Of course, your marketing clients want to see more customers! More customers mean they’re getting an ROI from your services. Understandably, this is really important for your clients. They want to see the numbers that prove their money is in good hands.
As a marketing consultant or agency, transparency around these numbers is a huge part of having a healthy, long-term relationship with your clients. Putting together SOPs that help your employees and contractors keep clients in “the know” is worth your time.
And remember—your clients are business owners (or executives). They’ve put their heart, soul, blood, sweat, AND tears into this business. They’ve dedicated late nights and early mornings. They’ve probably missed some pretty important events in their friend’s and family’s lives. This business means a lot to them, and getting to see more customers buying is special.
Make it a special moment for them by creating milestones to celebrate. For example, when they reach 1,000 customers, send them a gift or make sure to take the time to acknowledge it. Or, you can send gifts at certain revenue goals, like their first $500,000.
Here are a few customer metrics to share with your clients:
- The average number of customers per day/week/month
- The percent increase in customers since you started working with them
- The daily/weekly/monthly revenue
- Specific milestones (number of customers or revenue generated)

#5: Customer lifetime value
After someone becomes a customer, the marketing doesn’t stop. Conversion isn’t the last stage of the Customer Value Journey for a reason. There are FOUR more stages after it! Conversion is the halfway point of the Customer Value Journey, and there’s a lot that happens afterward.
When someone purchases a product, it’s time to get them excited (stage 5 of the Customer Value Journey). This excitement stage isn’t about upsells. It’s about showing them that they made the right decision by buying from you. This can be an unexpected free training, discount code, or stickers inside their ecommerce package.
Excitement leads to ascension (stage 6 of the Customer Value Journey). In ascension, your customer goes from buying your low-tier or middle-tier package to your highest (or one of your higher) tier packages. At DigitalMarketer, this is when someone goes from being a Lab member to becoming a Certified Partner or buying a ticket to Traffic & Conversion Summit.
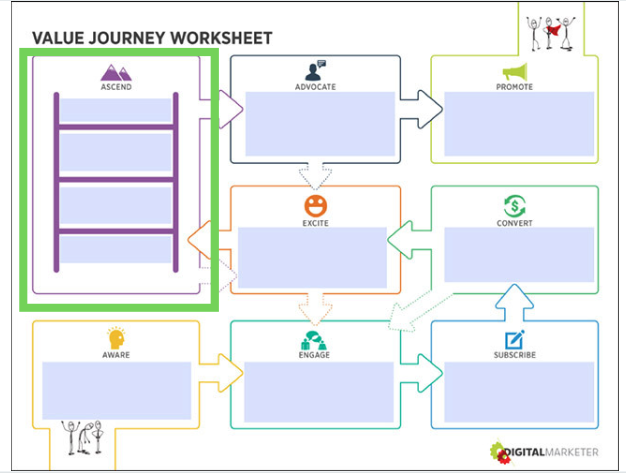
Think of ascension as the ladder that takes your revenue from “Awesome!” to “Holy crap!” This is where you increase customer lifetime value and turn your client’s brand into a long-term, sustainable business. When the funnels are in place to turn first-time customers into multiple-purchasing customers (and eventually raving fans of your brand and products), you’re in the magic zone.
Here are a few customer lifetime metrics to share with your clients:
- The average customer lifetime value (LTV)
- The LTV before and after you started working with this client
- The percentage increase in LTV
How To Get Rehired Again, and Again, and Again
Clients are happy to outsource their marketing to your consultancy or agency. Marketing is a lot of work (you know this as a business owner!), and it’s monumentally easier to have somebody else do it for you. It’s even easier to have the person who’s already doing your marketing…keep doing it.
That’s why you want to show your marketing clients these 5 metrics:
- Traffic
- Engagement
- Subscribers
- Customers
- Customer lifetime value
These are the metrics telling your clients that you’re increasing their brand awareness, qualifying leads, and ensuring they don’t build their business on someone else’s platform. They show an ROI when you turn those subscribers into customers and increase their customer lifetime value.
Wouldn’t you want to keep working with the marketer who did this for your company?
The answer is a big, obvious YES.
And with these metrics, that marketer can be you.
The post The 5 Metrics Every Marketing Client Wants to See appeared first on DigitalMarketer.
]]>